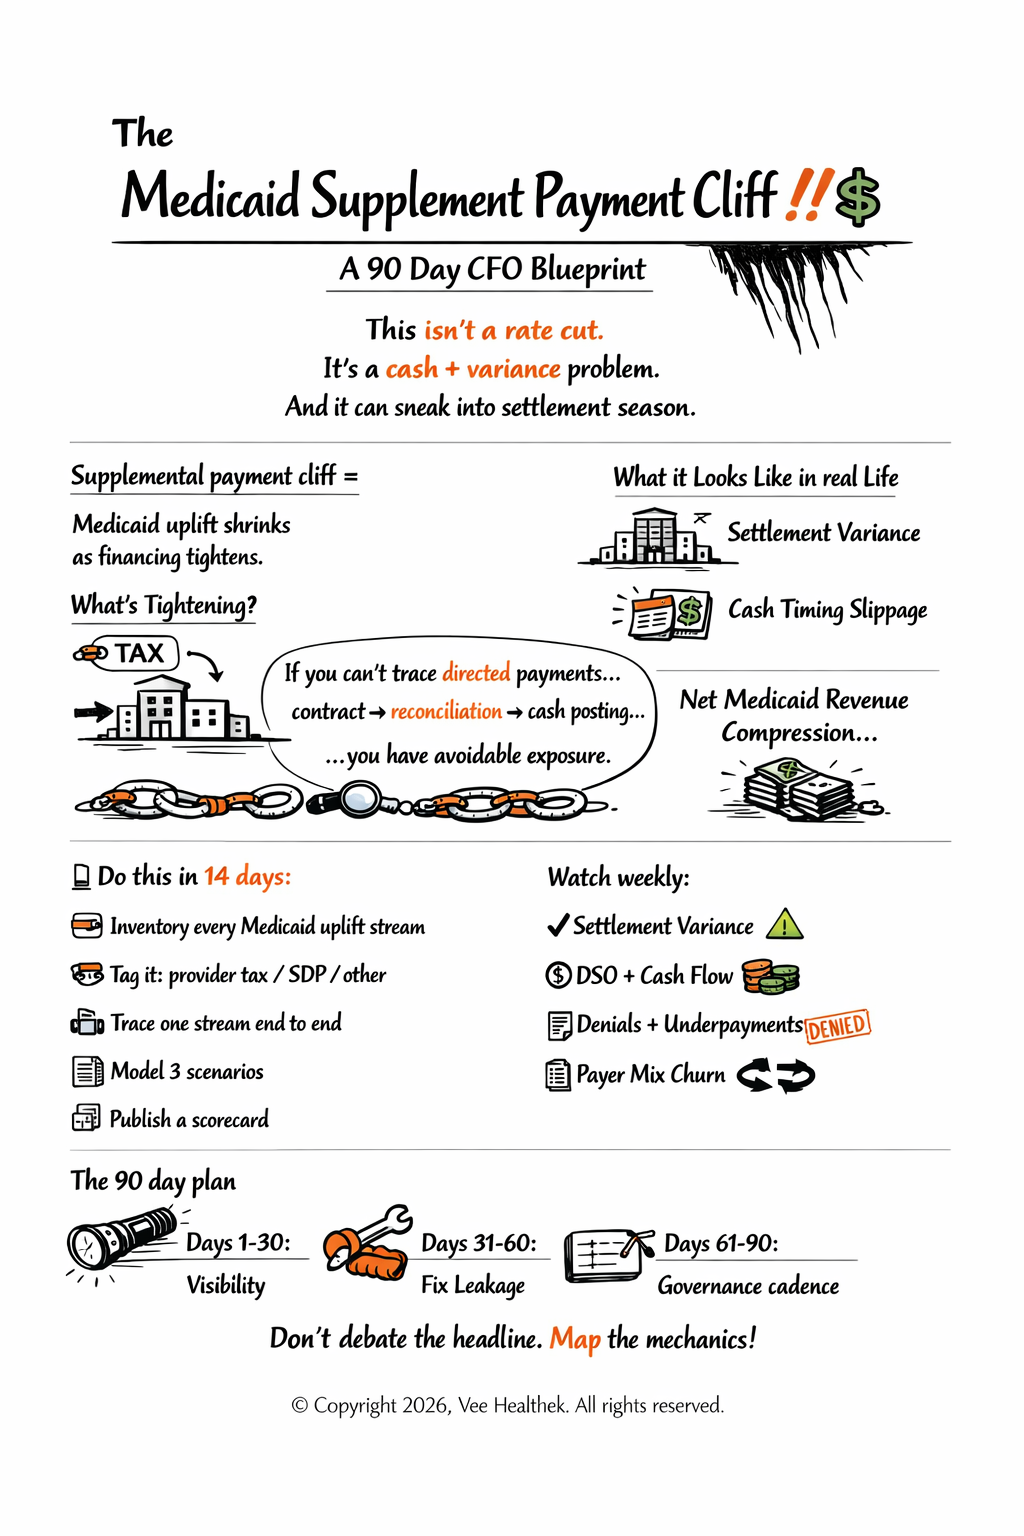

If your health system relies on Medicaid supplemental funding - directed payments through managed care, rate enhancements, or settlement-driven uplift – the One Big Beautiful Bill Act (OBBBA) introduces a real risk: a Medicaid supplemental payment cliff. In simple terms, when federal rules tighten around Medicaid provider taxes and state-directed payments (SDPs), states can have less flexibility to sustain supplemental payment capacity. The result is often not a single-day cut, but a phased squeeze that shows up as settlement variance, cash timing slippage, or net Medicaid revenue compression.
TL;DR
- OBBBA changes Medicaid financing mechanics; provider taxes and SDPs are specifically addressed in the law’s health coverage provisions.
- Treat this as a cash-and-variance problem: map every supplemental stream, model three scenarios, and harden revenue integrity in 90 days.
- If you can’t trace directed payments from contract → reconciliation → cash posting, you have avoidable exposure.
What Is The Medicaid Supplemental Payment Cliff?
It is the risk that Medicaid ‘uplift’ shrinks because the financing mechanics behind it tighten. The Medicaid supplemental payment cliff is not a single program. It’s a financial condition: supplemental Medicaid dollars that support hospital payments can compress when the state’s financing levers narrow. In many states, provider taxes and SDPs materially influence Medicaid payment capacity. When those levers are constrained, the impact can appear as a lower reconciliation, reduced directed payment levels, or slower cash realization—even if your core billing operations remain strong.
Why OBBBA Makes This A CFO Issue
The law’s scale and the specific financing provisions make supplementals worth board-level attention. In the Congressional Research Service (CRS) summary of OBBBA’s health coverage provisions, CBO estimates indicate federal outlays would be reduced by $907.5B over FY2025-FY2034, with Medicaid provisions accounting for $840.2B. CRS also reflects a CBO estimate of 9.1M more uninsured people in FY2034 from the health coverage provisions summarized, including 7.8M from the Medicaid provisions. Even if your market impact differs, the direction is clear: states will operate Medicaid programs under tighter constraints while health systems face higher volatility in payer mix and collections.
CRS also describes administrative changes that can increase churn, for example, eligibility redeterminations every six months for ACA expansion adults beginning December 31, 2026 (with an associated outlay reduction of $63.817B shown in the CRS table). This matters because churn and supplementals can move in the wrong direction at the same time: more eligibility friction can increase self-pay exposure just as Medicaid uplift tightens.
How Provider Taxes And State-Directed Payments (SDPs) Show Up In Cash
The risk shows up as settlement variance, underpayments, and timing issues; not just a rate line item. Most systems don’t ‘lose’ supplementals on a Tuesday. They discover the problem when expected directed payments don’t reconcile, settlement timing shifts, or underpayments age beyond what teams can recover. That’s why CFOs should treat the supplemental payment cliff like a credit event: you need traceability from contract terms to claim logic to reconciliation to cash posting. If any link in that chain is opaque, you’re exposed.
How To Quantify Exposure In 14 Days
These five steps produce a finance-grade baseline you can defend.
- Inventory every Medicaid uplift stream (directed payments, rate enhancements, settlements) and tag each as provider-tax dependent, SDP dependent, or other.
- For each stream, capture: owner, contract or approval reference, where it hits net patient service revenue and cash, and reconciliation timing.
- Pick one high-dollar stream and trace it end-to-end: contract → claims → reconciliation → cash posting. Document failure points.
- Build three scenarios (Base / Constrained / Highly Constrained) and quantify EBITDA-at-risk and cash impact by quarter.
- Publish a one-page scorecard: top three exposure drivers, top three operational fixes, and the next decision date.
A 90-Day Margin Protection Blueprint
- This is an operator plan to reduce variance while you still have time.
- Days 1-30 is visibility: complete the inventory, run scenarios, and align on the exposure scorecard.
- Days 31-60 is execution: fix the top leakage sources that worsen when supplementals tighten - denials, underpayments, and posting issues.
- Days 61-90 is governance: establish a lightweight ‘Medicaid Margin Office’ cadence to update assumptions, monitor reconciliation variance, and track recoveries.
Metrics That Reveal Risk Early
Watch these indicators weekly so issues surface before settlement season.
| Risk Signal | Metric To Watch | Immediate Action |
|---|---|---|
| Directed payment variance | Expected vs paid by program; settlement delta | Validate contract terms; reconcile monthly; open underpayment cases |
| Cash timing slippage | DSO by Medicaid MCO; cash posting latency | Fix remittance mapping; accelerate follow-up; tighten posting rules |
| Denials spike | Denial rate and top denial reasons | Root-cause top 3 codes; update edits/workflows; retrain |
| Underpayment leakage | Recovery rate and aging of underpayment cases | Automate detection; assign worklists; escalate to payer |
| Payer mix churn | Self-pay share; churn indicators tied to redeterminations | Strengthen front-end verification; financial clearance; charity workflows |
Decision Checklist: Are We Exposed?
If you can’t check at least four, treat this as urgent.
Core Thesis
- OBBBA tightens Medicaid financing mechanics; when provider taxes and SDPs tighten, supplemental Medicaid uplift can compress over time.
- The near-term CFO risk is unmodeled dependence on provider tax/SDP-driven supplementals that hits settlements and cash timing.
- The practical fix is operational: map every supplemental stream, run scenarios, and harden revenue integrity so surprises become managed variance.
How Vee Healthtek Can Help
Vee Healthtek is a service-led, technology-powered RCM partner focused on measurable outcomes. We help health systems (1) quantify Medicaid net-revenue exposure by building a finance-grade view of supplemental streams and operational drivers, (2) protect cash through revenue integrity, denial reduction, and underpayment recovery execution, and (3) operationalize a ‘Medicaid Margin Office’ cadence with dashboards, worklists, and accountability—so policy changes translate into timely actions.