

15 Revenue cycle analytics metrics healthcare leaders need
A practical guide to measuring RCM performance

September 17, 2026
Blog
7 min read

TL;DR
- Revenue cycle analytics should connect financial results with the operational conditions that create them.
- Leading indicators expose defects before they become denials, rework, delayed cash or write-offs.
- Consistent definitions, accountable owners and corrective action turn dashboards into measurable improvement.
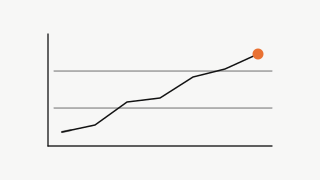
Revenue cycle analytics connects data to action. | Revenue cycle analytics
Revenue cycle analytics should use financial and operational data to reveal where revenue cycle performance is changing, why it is changing and what leaders should do next. The strongest measurement systems connect cash outcomes to upstream behaviors across patient access, documentation, coding, claims, payment and account resolution. For enterprise health systems and IDNs, the same definitions should remain comparable across facilities, specialties and business offices.
That connection matters because revenue cycle pressure is intensifying. McKinsey reported in 2024 that 15% of initial claims were denied by the end of 2023, compared with 9% in 2016. Healthcare leaders therefore need a scorecard that supports faster, more predictable cash conversion while identifying the defects that create avoidable rework.
Financial outcome metrics show whether revenue converts to cash. | Financial outcome metrics
These five lagging metrics quantify the economic outcome of revenue cycle performance. Their value increases when leaders analyze trends rather than isolated monthly snapshots and connect them with the actions required to reduce revenue leakage and protect earned reimbursement.
1. Net collection rate.
Net collection rate measures the percentage of collectible reimbursement received after contractual adjustments. It gives finance leaders an enterprise-level view of whether earned revenue is converting to cash.
2. Days in accounts receivable.
Days in accounts receivable shows how quickly outstanding balances convert to cash. Review it by payer, facility and balance age, especially where acute-care hospital revenue cycles combine high-dollar claims, inpatient complexity and unscheduled volume.
3. Accounts receivable over 90 days.
Accounts receivable over 90 days measures the share of receivables aging beyond 90 days. A rising percentage can signal payer delays, unresolved denials, weak follow-up or inaccurate prioritization, particularly across high-volume physician enterprises.
4. Final denial rate.
Final denial rate tracks claims that remain unpaid after prevention and appeal efforts. Unlike the initial denial rate, it reveals revenue ultimately lost rather than temporarily delayed and helps leaders focus transformation on recurring causes through connected revenue cycle accountability.
5. Cost to collect.
Cost to collect compares revenue cycle expense with cash collected. Interpret savings carefully because lower expense is not an improvement if reduced effort causes more aging, leakage or write-offs. The better objective is to remove avoidable rework behind every dollar collected.
Operational metrics reveal how efficiently work moves. | Operational performance metrics
Operational metrics explain the effort, delay and effectiveness behind financial outcomes. HFMA MAP Keys provide standardized revenue cycle definitions that support consistent measurement and comparison. They are especially valuable in academic medical centers, where facility, professional, teaching and specialty workflows intersect.
6. Clean claim rate.
Clean claim rate measures claims accepted without front-end payer edits or rejections. It reflects whether eligibility, authorization, documentation, coding and claim construction work together, including in ambulatory and outpatient sites where service and authorization windows are tight.
7. First-pass payment rate.
First-pass payment rate tracks claims paid as expected after initial submission without correction, appeal or manual intervention. It is a stronger expression of first-pass performance because acceptance alone does not confirm accurate payment. Revenue cycle execution ecosystems like RevAmp connect inventory, workflow rules, analytics and action so teams see where first-pass performance breaks.
8. Charge lag.
Charge lag measures elapsed time between the date of service and charge entry. Delays postpone billing, increase missing-charge risk and weaken downstream cash forecasts, especially in specialty and ancillary care where units, modifiers and source information determine billability.
9. Coding turnaround time.
Coding turnaround time tracks the time required to convert documentation into coded, billable services. Segmenting by specialty helps distinguish capacity constraints from documentation dependencies.
10. Appeal overturn rate.
Appeal overturn rate measures the percentage of appealed denials reversed by payers. Pair it with appeal volume, time and yield so successful recovery does not hide preventable upstream defects.
Leading indicators expose risk before cash is affected. | Leading indicator metrics
Leading indicators help teams intervene before defects become denials or aged receivables. The American Hospital Association notes that predictive analytics can identify likely denials and their causes, allowing proactive resolution. The objective is earlier action, not more alerts, and the ability to scale revenue cycle capacity with technology without multiplying manual queues.
11. Insurance verification rate.
Insurance verification rate measures whether coverage is confirmed before service. Low performance increases rejection risk and transfers preventable work into downstream workflows that can also undermine the patient financial experience.
12. Authorization success rate.
Authorization success rate tracks approvals secured correctly before care. Analyze failures by payer, service, location and reason.
13. Eligibility rejection rate.
Eligibility rejection rate shows how often claims fail because coverage or demographic information is inaccurate. It predicts front-end rework.
14. Documentation query rate.
Documentation query rate measures encounters requiring clarification before coding or billing. Persistent patterns reveal opportunities in documentation completeness.
15. Rework rate.
Rework rate measures claims or accounts requiring avoidable repeat activity. Attribute rework to the defect that created it, not merely the team correcting it.
Segmentation turns an enterprise average into a diagnosis. | Segment and review metrics
Every metric should be segmented by payer, facility, specialty, location, encounter type, denial reason and process stage where relevant. Oliver Wyman’s 2026 RCM survey illustrates why enterprise adoption and end-user use should be examined together when evaluating analytics-enabled workflows. Segmentation should also reflect the operating environment, whether work is delivered natively through Epic revenue cycle workflows, NextGen Healthcare workflows, athenaOne workflows, or other EHRs’ workflows. Enterprise averages can appear stable while a payer, site or workflow deteriorates.
Trend views should compare current performance with prior periods, internal targets and reliable external benchmarks. Leaders should review numerator and denominator changes because an improved percentage may reflect changing case mix rather than a better process.
Review cadence and ownership create open accountability.
Not every metric requires the same cadence. Front-end and clean-claim signals may need daily monitoring; workflow and denial metrics often warrant weekly review; cash, aging and cost measures support monthly executive governance. Alerts should reflect meaningful variance.
Each metric needs a named operational owner, a defined threshold and an agreed corrective action. Open accountability makes the connection visible from metric to root cause, intervention, owner and verified outcome. That is how analytics becomes a management system for sustained improvement.

Frequently Asked Questions
What is revenue cycle analytics in healthcare?

Which revenue cycle metrics matter most?
What should a revenue cycle dashboard include?
How often should RCM metrics be reviewed?
How does analytics reduce claim denials?
How should healthcare providers measure rework?
Extend performance across connected outcomes.


Revenue cycle thinking for leaders who need fewer surprises.
Explore Vee Healthtek perspectives on the forces reshaping revenue cycle performance, healthcare operations, technology adoption, and financial resilience.

Ready to make every RCM metric actionable?
Complete the form to identify where stronger analytics, clearer ownership and targeted interventions can improve cash, reduce rework and strengthen revenue cycle performance.
Continue exploring expert perspectives, industry trends, and practical strategies for improving revenue cycle performance.
Explore Points Of View