


Showing items3 of 6

Your payer contracts are leaving money behind.
Payment can look complete while revenue remains missing. | Why Paid Claims Hide Revenue
The claim says paid. The contract says otherwise.
Repeated across a high-volume contract, a modest shortfall becomes a material financial loss. Because the claim was paid, the variance can bypass denial reports and traditional exception queues, allowing the same pricing error to weaken reimbursement across service lines and reporting periods.
Finance leaders need a reimbursement variance assessment that converts claim-level differences into enterprise exposure and directs action toward the most recoverable value. Measuring these gaps alongside claim volume, recurrence and recovery deadlines allows finance leaders to quantify the full exposure, distinguish isolated errors from systemic patterns and prioritize the revenue most likely to be recovered.
Contract leakage stays hidden when payment is treated as proof. | Paid Claims Versus Denials
Underpayments can go unnoticed because the claims were paid and closed rather than denied. Once the balance adjusts, the account leaves active work queues, even when the remittance reflects an incorrect rate, bundling rule, modifier treatment or contractual adjustment. A strong payer contracting process has to test whether cash matches the agreement instead of treating remittance as evidence of accuracy.
Margin pressure makes payer friction a two-sided financial problem: hospitals lose revenue when payments fall short and spend more trying to recover it. The American Hospital Association reported that hospitals spent an estimated $19.7 billion in 2022 overturning denied claims and absorbed $130 billion in Medicare and Medicaid underpayments in 2023. The financial impact extends beyond missing reimbursement to the added cost of collecting revenue already earned.
Expected reimbursement creates the baseline for every comparison. | Six Leakage Categories
Start where the financial stakes are highest: contracts with significant revenue, claim volume and recurring payment discrepancies. Then calculate what each claim should have paid under the contract terms in effect on the service date. Connecting this expected amount with coding, charging and billing data helps analysts distinguish payer errors from issues in the underlying claim. Strong revenue integrity keeps recovery efforts focused on valid payment gaps.
These inputs define the minimum baseline for expected reimbursement:
- The executed contract version and effective dates.
- The service, code, modifier and site-of-service combination.
- The payer policy and remittance logic applied to the claim.
- The actual allowed amount, payment and contractual adjustment.
Model validation is as important as model construction. Sampling should reconcile calculated expectations to known accurate payments and involve medical coding or charge capture expertise when clinical or billing details can change reimbursement. This limits false positives and prevents analysts from creating rework around variances the contract supports.
Claim-level variance becomes useful when it is scaled. | Small Variances Become Material
An individual difference gains executive meaning only after the organization estimates how often it repeats. Use this formula:
Average payment shortfall × eligible claim volume × incidence rate = Estimated revenue exposure
- Average payment shortfall: Average difference between expected and actual reimbursement for validated underpaid claims.
- Eligible claim volume: Total number of similar claims that could contain the same payment issue.
- Incidence rate: Percentage of reviewed claims where the shortfall occurred.
- Estimated revenue exposure: Projected value at risk, not guaranteed recoverable revenue.
Segmenting results by payer, service line, procedure, modifier and location shows where exposure concentrates. Teams can then connect recurring patterns to payment posting, clean-claim validation and claim submission. This reveals whether the variance reflects payer adjudication, contract-model logic or an upstream claim defect.
A simple exposure framework turns variance into a decision. | Five Contract Performance Questions
This framework shows how claim-level findings roll into an enterprise estimate.
Recovery priorities require more than the largest variance.
Dollar size alone can misdirect effort. A large discrepancy with weak contractual support or an expired filing window may yield less cash than a modest, recurring variance with clear evidence. Underpayment recovery should rank opportunities by total exposure, recoverability and time remaining, then route validated disputes before deadlines narrow.
How should CFOs prioritize payer contracts for review? Begin with contracts that combine high net revenue, high claim volume, complex reimbursement terms and repeated payment variances. A small variance in a high-value contract generally creates greater financial exposure than a large but isolated discrepancy in a low-volume agreement.
Prioritization becomes stronger when leaders also examine the labor required to recover each dollar. Accounts receivable follow-up and denials and appeals data can reveal payer response times, documentation burdens and escalation patterns. This converts gross exposure into a more realistic view of recoverable value and cost-to-collect.
Root-cause ownership protects future reimbursement. | Follow Cash to Source
Recovering an underpayment addresses the immediate cash loss, but greater financial benefit comes from identifying why the shortfall occurred and correcting the workflow before the same issue affects more claims. Contract configuration errors, missing modifiers and incorrect adjustment logic require different responses, but each finding should lead to a specific owner and corrective action. Applying these lessons to future claims strengthens first-pass performance and prevents teams from repeatedly recovering the same revenue.
Leaders can then monitor whether the correction improved payment accuracy and whether the shortfall continues across subsequent claims. Connecting this analysis to revenue leakage prevention shifts the measure of success from cash recovered once to revenue protected across future claim volume.
Vee Healthtek converts payment variance into accountable action. | Build Revenue Resilience
Finding the exposure is only the first step. Recovery depends on confirming which payment gaps are valid, determining which opportunities warrant immediate action and tracing recurring shortfalls back to their source. The assessment becomes more valuable when its findings guide both near-term recovery and workflow changes that improve payment accuracy across future claims.
Vee Healthtek follows payment variance from contract terms through remittance to identify where expected reimbursement breaks and how much value the pattern places at risk. Practitioner-led analysis validates recoverability, shapes work around payer behavior and connects findings to workflow updates that improve reimbursement predictability without creating another layer of disconnected review.
AI-enabled prioritization directs attention toward high-value, time-sensitive opportunities while scalable execution supports recovery across payer and service-line inventories. Outcome-based governance shows whether interventions accelerate cash, reduce cost-to-collect and prevent repeat leakage. A physician enterprise example demonstrates how a learning system can reduce accounts receivable (A/R) while hardening claim logic, reinforcing the value of pairing recovery with prevention.
Key takeaways | Key Takeaways
- A closed claim can still contain a recurring payment variance.
- Expected reimbursement must reflect contract, code, modifier and site-specific logic.
- Exposure equals average variance multiplied by affected volume and recurrence rate.
- Recovery priority combines value, recoverability, labor and filing-window risk.
- Root-cause ownership turns one-time recovery into stronger future reimbursement.

Why approval rates miss the real cost of prior authorization
High prior authorization approval rates can still hide care delays, slower cash, and rising administrative costs. Approval rates reveal little about revenue held in unresolved cases or scheduled capacity affected by payer decisions. Health systems need to manage prior authorization as a revenue-risk workflow tied to cash timing, payer performance, and service-line economics.
Prior authorization in healthcare revenue cycle management is the payer approval process required before selected services qualify for reimbursement. The issue carries added urgency as 2026 comes to a close. Impacted payers are now operating under requirements that generally took effect January 1, 2026, while major API requirements generally take effect in 2027. The current transition gives finance and revenue cycle leaders a limited planning window to establish baseline performance, use newly available payer data, and prepare integrations before electronic exchange expands.
Authorization performance can give finance a false signal. | Authorization Performance Signals
Health systems often evaluate prior authorization through approval rates, productivity, and work-queue volume. These measures show activity, though they provide an incomplete view of financial performance. A case approved after cancellation can count as a successful authorization while the associated revenue moves out of the forecast. An approval obtained after several manual touches can protect reimbursement while increasing cost-to-collect.
A more useful executive view connects authorization status with expected reimbursement and scheduled capacity. Finance and revenue cycle leaders should be able to see:
- Revenue tied to unresolved cases within the next 3, 7, and 14 days
- Expected reimbursement delayed by authorization-related rescheduling
- Authorization labor cost by payer and service line
- Initial denials caused by missing, expired, or mismatched approvals
- Scheduled capacity at risk because payer decisions remain pending
This model exposes the difference between administrative completion and financial conversion. It also gives treasury and finance teams a clearer view of revenue likely to shift between reporting periods.
Payer requirements create a shadow discount on contracted revenue. | Shadow Discount on Revenue
A negotiated rate overstates payer value when the health system must absorb repeated follow-up, clinical escalation, rescheduling, or appeal costs before receiving payment. Payer-specific authorization friction creates a shadow discount on contracted revenue because administrative cost and cash delay reduce the economic value of the agreed rate.
Two payers may reimburse the same amount for an outpatient procedure while producing different margins. One may accept a consistent documentation set and issue timely decisions. Another may require additional records, route cases through clinical review, and generate more post-service disputes. Equal contracted rates can therefore produce unequal net revenue.
Payer scorecards should extend beyond reimbursement rates and denial percentages. Useful comparisons include:
- Authorization touch count and labor minutes per request
- Median decision time by service category
- Approval timing relative to the scheduled service date
- Appeal overturn rate
- Authorization-related reschedule and cancellation value
- Cost-to-collect after administrative effort
Impacted payers must publish prior authorization measures from the previous calendar year, including approval and denial rates, appeal outcomes, and response times. They must also publish a clear list of medical items and services requiring prior authorization, excluding drugs.
Public payer metrics offer a benchmark, while internal data shows the true cost of delays, denials, and rework. Health systems can use both sources to strengthen payer negotiations and assess how authorization requirements affect contract economics.
The 2026 rules create an operating deadline, while 2027 creates a technology decision. | 2026 and 2027 Deadlines
Medicare Advantage and affected Medicaid and CHIP payers generally have 72 hours for expedited requests and seven calendar days for standard requests. These timeframes apply to covered medical items and services, excluding drugs.
Faster payer decisions improve only the portion of the cycle after the payer receives a complete request. Internal delays can consume several days while teams collect clinical documentation, resolve eligibility questions, or identify the correct submission process. The health system can still experience a long authorization cycle even when the payer meets its deadline.
CMS places the 2027 API requirements on impacted payers. Health systems must decide how to integrate the new connections into authorization workflows. Current EHR, clearinghouse, and workflow technology must be able to use the data without creating another disconnected queue.
A practical 2026 readiness plan should address:
- Current authorization cycle time before payer submission
- Payer and service categories covered by the rule
- Drug authorizations and commercial plans outside the rule’s scope
- EHR and workflow integration requirements
- Expected labor reduction and implementation cost
- Ownership of API data quality and exception handling
The business case should measure more than staff hours saved. It should estimate cash acceleration, avoided reschedules, denial reduction, and capacity protected by earlier decisions.
Prior authorization exposure should enter cash forecasting. | Authorization-Weighted Cash Forecasting
Authorization work frequently sits outside the data used for short-term cash forecasting. This separation leaves finance teams unable to distinguish scheduled revenue likely to proceed from revenue dependent on unresolved payer approval.
A revenue-weighted authorization forecast can close this gap. Each scheduled case can receive an exposure value based on:
- Expected net reimbursement
- Time remaining before the service date
- Documentation readiness
- Historical payer response time
- Financial effect of rescheduling or cancellation
Finance teams can then segment scheduled revenue by authorization status. Approved cases carry greater payment certainty. Exposed cases require intervention before the service date, while delayed cases may shift into a later forecast period.
The same analysis can quantify A/R risk. A service performed with an invalid authorization may enter billing on time while carrying a higher probability of denial, appeal, or write-off. Flagging this exposure before service creates an opportunity to prevent the receivable rather than manage it after the claim fails.
Service-line growth requires authorization economics. | Service-Line Authorization Economics
Prior authorization can influence whether increased demand produces profitable growth. A health system may recruit specialists, add procedural capacity, or expand an infusion program while underestimating the authorization infrastructure needed to support higher volume. Scheduled demand can rise while collectible revenue trails because approvals miss treatment dates or require labor beyond the original business case.
Growth models should include the percentage of projected volume requiring authorization, expected approval lead time, and payer mix. They should also account for staff capacity, clinical escalation requirements, and the direct cost of unused procedural capacity.
This analysis helps leadership answer a more consequential question: Can the revenue cycle support the planned service volume at the assumed margin? If authorization readiness cannot scale with demand, the expansion plan requires workflow investment before additional clinical capacity comes online.
Update workflows to prevent avoidable rework and build revenue resilience. | Workflow and Revenue Resilience
Preventing avoidable rework requires earlier identification of payer requirements and clearer escalation paths. Authorization screening should begin as close to the scheduling or ordering decision as available information allows. Cases with high reimbursement value, short lead times, or complex clinical criteria should enter prioritized queues instead of moving through standard first-in, first-out processing.
Workflow rules should define when a case needs clinical documentation, peer-to-peer review, or financial clearance. Leaders should also assign responsibility for payer-rule maintenance and monitor whether updates reach schedulers, patient access teams, and authorization specialists before outdated requirements generate denials.
A financially aligned scorecard should track:
- Pre-service resolution rate
- Revenue-weighted approval timeliness
- Revenue exposed within scheduled service windows
- Authorization-related initial denial rate
- Avoidable reschedule value
- Cost per resolved authorization
Together, these measures reveal whether the organization protects reimbursement before service, controls administrative cost, and supports operational continuity.
How Vee Healthtek supports prior authorization performance. | How Vee Healthtek Helps
Vee Healthtek combines practitioner-led revenue cycle expertise, AI-enabled workflows, and global delivery to strengthen prior authorization performance. Teams connect payer requirements, clinical documentation, and service-date risk to identify high-priority cases earlier and move them through the right escalation path before delays affect care or reimbursement.
AI-enabled workflows monitor changing payer rules, surface missing information, and prioritize work by financial and operational risk. This earlier intervention reduces avoidable rework caused by incomplete submissions, repeated payer follow-up, documentation retrieval, rescheduling, and appeals. Clear governance and visible performance measures help organizations manage authorization volume consistently across payers, facilities, and service lines.
Stronger First-Pass Performance means fewer avoidable delays and denials and less administrative effort spent correcting preventable issues. Earlier visibility into revenue and scheduled capacity at risk helps leaders protect reimbursement, control cost-to-collect, and create a more predictable path from scheduled care to payment.
Key Takeaways
- Approval rates can mask revenue delays, excess labor, and lost scheduled capacity.
- Public payer metrics create a new opportunity to quantify authorization friction during payer negotiations.
- The 2026 operating requirements and 2027 API deadline require coordinated revenue cycle, finance, and technology planning.
- Revenue-weighted authorization reporting can strengthen cash forecasts and expose service-line risk earlier.
- Authorization capacity should enter growth planning before clinical volume expands.

Finding revenue hidden in payer contracts.
Why paid claims hide revenue loss. | Why Paid Claims Hide Revenue
A paid claim can look complete while the payer still keeps part of the contracted reimbursement. When payment posting closes the account using an incorrect allowed amount or contractual adjustment, denial reports remain clean while cash, margin and forecast accuracy weaken. The central issue is payment accuracy: payer contracts create revenue only when negotiated terms become executable rules and every payment is tested against them.
Revenue hidden in payer contracts is the difference between the reimbursement a provider negotiated and the amount received after adjudication. Common causes include outdated fee schedules, missed escalators, modifier errors, service-specific discrepancies and terms that never reached operating workflows. Unlike a denial, a payer underpayment may post as a completed transaction, which makes conventional denial reporting an incomplete view of reimbursement performance.
Paid claims require a different control than denials. | Paid Claims Versus Denials
Denial management asks whether the payer refused payment. Contract compliance asks whether the payer paid the correct amount. Combining both questions allows managed care leaders to distinguish a clean adjudication from a financially correct outcome and prevent short payments from disappearing into routine adjustments.
The risk grows when contract terms live in documents while expected reimbursement logic sits elsewhere. Payment posting may classify an adjustment correctly according to system configuration even when the configuration uses an old fee schedule. Accurate payment reconciliation therefore depends on current contract logic, remittance detail and a defined route for exceptions.
Six categories reveal hidden payer contract revenue. | Six Leakage Categories
The Payer Contract Revenue Leakage Framework organizes investigation around six categories, each tied to a different operational owner and recovery path:
Rate integrity begins with expected reimbursement. Current contract rates must match the fee schedules and grouper logic used to price claims. Revenue integrity teams can then separate payer mispricing from internal coding, charging or configuration defects before recovery work begins.
Escalator capture tests whether scheduled increases took effect on the correct date. Modifier and service alignment examine whether payer rules changed reimbursement for the coded service, location or care setting. Strong claims validation reduces preventable submission defects, while post-payment analysis confirms the payer honored the resulting claim.
Rule operability exposes contract language that finance can negotiate but operations cannot reliably execute. Material exposure then ranks findings by total value, using claim volume, variance size and recovery window rather than reviewing every difference equally. This focus aligns A/R recovery capacity with the reimbursement at greatest risk.
Small payment variances become material exposure. | Small Payment Variances
A $20 variance appears immaterial until it repeats across 25,000 claims, producing $500,000 in exposure before recovery cost. Aggregation changes the leadership decision: finance needs variance reporting by payer, contract, service line and code family so recurring patterns become visible before appeal windows close.
Measurement should connect gross variance to recovered cash, preventable recurrence and labor consumed. A recovery total without the original defect can reward repeated cleanup. Tracking first-pass reimbursement accuracy alongside denial prevention shows whether the organization is protecting cash upstream or repeatedly paying to collect the same dollar.
Five questions sharpen contract performance reviews. | Contract Performance Questions
Leaders can test whether contract compliance reaches daily revenue cycle work by asking five questions:
- Which contracts generate the largest gap between expected and actual reimbursement?
- Are annual escalators loaded, tested and evident in cash yield after their effective dates?
- Which modifiers, service lines or sites account for recurring payer variance?
- How quickly do posting exceptions reach recovery teams with the required evidence?
- Which recovered variances produce an upstream rule change that prevents repeat leakage?
Answers require shared ownership across contracting, information technology, coding, billing and payment operations. Payer analytics should support contract negotiations with claim-level evidence while preserving a clear line from signed term to collected cash.
A payer contract audit should follow cash to source. | Payer Contract Audit
A focused audit can begin with a representative claim population and expand where the exposure supports deeper review. The checklist should examine:
- Contract and fee schedule version control.
- Expected-payment logic by payer and plan.
- Escalator effective dates and test claims.
- Modifier, carve-out and site-of-service rules.
- Adjustment mapping and zero-balance closures.
- Variance routing, dispute deadlines and recovery results.
Sampling should include paid claims, because zero balances can conceal incorrect adjustments. Connecting coding quality and contract logic helps teams avoid disputing a payer when the source issue sits in documentation or coding, while preserving defensible recovery when the payer failed to honor the agreement.
Accountable workflows build revenue resilience. | Building Revenue Resilience
Payer agreements do not protect margin by themselves. Financial value appears when negotiated terms become current pricing logic, payment differences trigger timely action and recurring defects produce a measurable workflow change. This operating discipline closes the gap between contract strategy and healthcare reimbursement.
The strongest leadership move is to treat paid-claim accuracy as a standing revenue cycle performance measure. Doing so improves cash visibility, reduces avoidable accounts receivable (A/R) work and gives forecasting teams a more reliable view of payer yield as contract complexity grows.
Vee Healthtek follows reimbursement from contract terms through remittance to identify where payment variance enters the revenue cycle and where repeated intervention consumes margin. Practitioner-led analysis connects expected-payment logic with underpayment recovery, then redesigns exception routing so high-value discrepancies reach the right expertise before recovery windows narrow. Leaders gain visibility into recovered cash, recurring payer behavior and upstream changes that prevent avoidable rework, making reimbursement more predictable while supporting scalable execution and stronger revenue resilience.
Key takeaways
- Paid status confirms adjudication, not reimbursement accuracy.
- Six leakage categories create a repeatable contract review structure.
- Aggregate exposure should determine recovery priority.
- Expected-payment analytics need accountable exception workflows.
- Upstream correction protects margin from recurring rework.

Contracted rate vs. realized reimbursement
A higher contracted rate can still produce a lower return. Payers can change reimbursement economics through tighter prior authorization rules, narrower medical necessity criteria, expanded coding edits, and additional documentation requirements. These policies give payers greater influence over utilization and claim expense without reopening contracts. Providers retain the negotiated rate on paper while absorbing more denials, longer payment cycles, and greater collection effort.
Realized reimbursement is the amount a healthcare organization ultimately collects after payer policies and claim requirements affect the contracted amount. Negotiated rates measure pricing, while realized reimbursement measures how effectively expected revenue becomes cash. Protecting healthcare financial performance requires claim-level visibility into payment loss, payment delays, and the administrative cost of collection.
How payer policies reduce the effective value of provider contracted rates. | Contracted Rates Versus Returns
A contracted rate applies only when a claim satisfies every payment condition. Each new payer requirement creates another point where reimbursement can decrease or stall. The combined effect can function like a shadow discount for the provider: the published rate remains unchanged while denials, partial payments, delayed cash, and recovery expenses reduce its effective value.
A health system can negotiate a rate increase and realize little margin improvement. Consider a service line with $50 million in annual allowed reimbursement. A 4% increase appears to add $2 million. If policy changes contribute to a 2% decline in payment realization and $750,000 in incremental collection expense, more than half of the expected value disappears before accounting for delayed cash. This illustrative example shows why rate schedules alone provide an incomplete view of payer economics. Here are five actions CFOs can take to identify this exposure and protect reimbursement.
1. Measure net reimbursement yield. | Measurenet Reimbursement Yield
Realized reimbursement rate offers a useful starting point:
Realized reimbursement rate = Net payment collected ÷ Expected allowed reimbursement
Organizations should calculate this measure by payer, plan, service line, procedure, and facility. A payer may perform well in aggregate while producing material losses across a narrow group of high-value services.
A second measure adds the cost required to secure payment:
Net reimbursement yield = (Cash collected − incremental collection expense) ÷ Expected allowed reimbursement
Collection expense may include authorization corrections, clinical record retrieval, coding reviews, appeals, and A/R follow-up. Two payers may eventually reimburse the same amount, while one requires substantially more intervention and holds cash longer. Net reimbursement yield exposes the difference in margin contribution.
Leaders should separate reimbursement erosion into three categories:
- Payment loss: Denials, downgrades, and unresolved underpayments
- Payment delay: Claim pends, record requests, and extended reviews
- Collection expense: Corrections, appeals, and follow-up activity
This distinction shows whether the organization needs to prevent revenue leakage, accelerate cash, or reduce cost-to-collect.
2. Identify the policies creating the largest economic discount. | Find Policy-Driven Discounts
Monthly denial totals show where claims failed, although they may obscure the payer policy driving the failures. Revenue cycle leaders should connect denials, underpayments, and payment delays to specific policy changes and effective dates.
Start with payers and service lines where contracted rates improved while payment realization, collection time, or denial performance worsened. This contradiction can reveal policy-driven erosion inside an apparently favorable agreement.
A payer policy impact scorecard should capture:
- Affected payer, plan, service, and claim population
- Expected reimbursement exposure
- Likely effect on payment timing
- Incremental collection effort
- Workflow requiring an update
- Implementation owner and validation date
Leaders can prioritize each change using a basic exposure calculation:
Financial exposure = Affected claim volume × Expected reimbursement variance × Probability of nonrecovery
This approach directs resources toward material risks rather than treating every policy bulletin with equal urgency.
3. Connect each policy to the earliest preventable failure. | Prevent Failures Earlier
Payer policies often reach revenue cycle functions as separate operational updates. Patient access receives a new authorization rule. Utilization review sees revised medical necessity criteria. Coding encounters a new edit after services have already occurred.
A policy-impact review should identify where the organization can reliably prevent the failure. For example, a payer may require additional clinical evidence for an imaging procedure. Updating the authorization workflow alone may leave exposure if the medical record lacks the required evidence. Scheduling must identify affected appointments, clinicians need relevant documentation guidance, and utilization review must validate medical necessity before billing.
Teams should answer four questions for each material change:
- Which claims and services fall within scope?
- Which workflow contains the earliest intervention point?
- Which accounts already in progress carry exposure?
- Which performance measure will validate the response?
This process moves denial prevention upstream and protects first-pass yield. It also prevents staff from discovering new requirements after claims enter A/R.
4. Incorporate payer behavior into forecasts and governance. | Improve Forecasts and Governance
Cash forecasts based primarily on contracted rates can overstate expected collections when payer policies lower payment probability or extend processing time. Finance teams should apply payer-specific realization and timing factors to expected reimbursement.
Forecast assumptions might reflect:
- Historical payment realization for affected claim cohorts
- Average time from initial submission to final payment
- Appeal success rates and recovery time
- Policy-related denial and underpayment trends
These factors help finance distinguish temporary execution issues from a structural change in payer economics. They can also improve denial reserves, service-line margin analysis, and near-term cash projections.
Revenue cycle governance should assign clear ownership for policy intake, interpretation, implementation, validation, and escalation. Each material change needs an effective date, financial exposure estimate, accountable owner, and expected outcome.
Monthly payer performance reviews should address five questions:
- Where is the gap between expected and realized reimbursement growing?
- Which policies created the greatest cash or margin exposure?
- Where did requirements fail to reach workflows before the effective date?
- How much collection effort did the organization expend?
- Which trends require payer escalation or contract action?
5. Update workflows before policy changes become denials. | Update Workflows Proactively
Large-scale transformation is rarely the first requirement. Most organizations need a faster process for inserting new payer requirements into existing workflows. An authorization prompt during scheduling, updated documentation guidance at the point of care, or a payer-specific prebill edit can prevent a policy change from becoming a denial.
Workflow updates should occur at the earliest reliable intervention point. A billing edit may catch an issue before submission, although it may arrive too late to correct missing clinical evidence. Earlier controls protect reimbursement and reduce the labor required for claim correction, appeal preparation, and follow-up.
Leaders should measure whether each update produces a financial result:
- Avoided denial value
- Improvement in first-pass yield
- Change in A/R days
- Reduction in account touches
- Net effect on cost-to-collect
Centralizing payer requirements also supports operational continuity. Governed rules reduce dependence on individual knowledge and local spreadsheets. Faster policy implementation limits leakage, prevents avoidable rework, and strengthens revenue resilience across facilities and service lines.
How Vee Healthtek helps protect realized reimbursement. | Protect Realized Reimbursement
Payer policy intelligence creates value only when it changes how teams work before a claim fails. Vee Healthtek helps healthcare organizations build a direct path from policy identification to financial action. Revenue cycle specialists assess which claims carry exposure, identify the earliest workflow where teams can prevent payment loss, and implement the required update across patient access, utilization review, coding, billing, denial management, underpayment recovery, or A/R follow-up.
The approach focuses on three outcomes:
- Detect reimbursement risk earlier: AI-enabled analysis identifies emerging payment variance and prioritizes affected claims by financial exposure.
- Act before revenue enters extended A/R: Payer requirements move into existing work queues, documentation guidance, claim edits, and escalation processes at the earliest reliable intervention point.
- Measure the economic result: Performance tracking connects workflow updates to net reimbursement yield, first-pass yield, denial reduction, cash acceleration, and cost-to-collect.
Vee Healthtek combines revenue cycle expertise, practitioner insight, workflow design, and a global delivery architecture to support consistent execution across payers, facilities, and service lines. This structure helps organizations respond to policy changes without relying on disconnected spreadsheets, individual knowledge, or recovery work after claims have already failed.
The result is a more accountable approach to reducing preventable denials, improving financial predictability, and building revenue resilience as payer requirements continue to change.
Key takeaways
- Contracted rates can overstate the economic value of a payer relationship.
- Payer policies can reduce effective reimbursement through payment loss, delay, and collection expense.
- Net reimbursement yield reveals the margin impact hidden by traditional rate analysis.
- Policy impact should influence forecasts, workflow priorities, and payer negotiations.
- Timely workflow updates prevent avoidable rework and strengthen revenue resilience.

Where revenue cycle leaders should scale AI for ROI
Revenue cycle AI has reached a portfolio decision point.
For Heads of Revenue Cycle, the question is no longer whether Artificial Intelligence (AI) belongs in Revenue Cycle Management (RCM). It is where AI should move from experiment to scaled execution. Bessemer Venture Partners and Bain & Company’s 2026 Healthcare AI ROI Scorecard reports 4.0x realized ROI for provider revenue cycle AI and says 67% of provider RCM respondents run semi-autonomous or fully autonomous agents. Those category-level findings are a signal, not a blanket business case: each workflow must still earn its place in the portfolio.
Adoption and ROI create a practical revenue cycle AI roadmap. | Read The ROI Map
The report’s ROI Scorecard plots overall adoption horizontally and realized ROI vertically. For revenue cycle leaders, four portfolio positions translate into practical choices: scale high-adoption, high-return workflows; validate low-adoption, high-return opportunities; redesign adopted workflows with weaker returns; and monitor immature use cases. This view is more useful than counting pilots because it connects deployment maturity to value already realized.
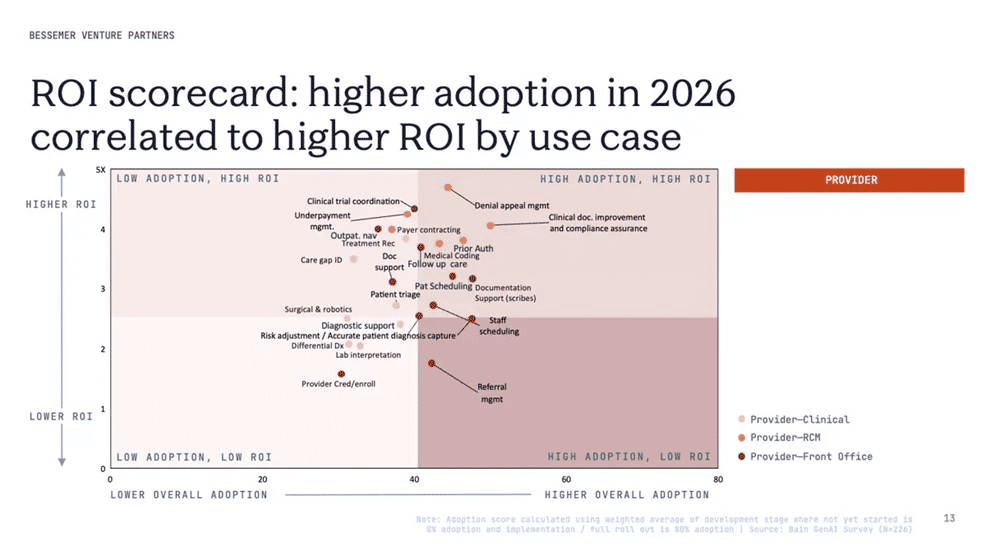
Figure 1. Provider AI use cases mapped by adoption and realized ROI.
Source: Bessemer Venture Partners and Bain & Company, The 2026 Healthcare AI ROI Scorecard; Bain GenAI Survey, N=226.
Scale the revenue cycle workflows already combining adoption and return. | Scale Proven Workflows
Denials should become a prevention system, not a faster appeal queue.
Denial and appeal management is a scale-ready workflow with measurable potential. HFMA reported in 2026 that about one in five providers applied AI to denials management, showing that strong potential does not equal universal maturity. Leaders should use AI to prioritize work and assemble evidence, then feed denial intelligence upstream into eligibility and benefits verification, prior authorization and clean-claim controls. Otherwise, AI merely accelerates rework.
CDI and coding need accuracy before autonomy.
Clinical documentation improvement and compliance assurance, prior authorization and medical coding are also strong candidates for selective scale. AHIMA noted in 2024 that weak documentation and coding quality can drag down AI performance. Scale should therefore pair clinical documentation integrity with medical coding, audit controls and expert validation. The goal is not touchless work at any cost. It is defensible first-pass performance that reduces corrections after submission.
Validate high-return opportunities before the industry normalizes them. | Validate Emerging Opportunities
Underpayment management combines promising returns with room for wider adoption. That makes underpayment recovery and payer variance resolution a candidate for controlled validation: establish a baseline, define recoverable variance, account for implementation cost and test whether detection converts into cash. Likewise, leaders should connect revenue integrity and leakage prevention to contract intelligence and payment outcomes rather than treating alerts as value.
Investigate adopted workflows that are not returning enough.
Patient scheduling and referral management require a sharper outcome definition. That does not make either workflow unimportant. It means leaders should sharpen the outcome definition. For scheduling and registration, is AI improving completed appointments, registration quality or staff capacity? For patient access management, is automation preventing downstream denials or simply moving more tasks? Adoption without an explicit financial and operational path can make a busy workflow look successful while the revenue cycle still cleans up its defects.
Build an AI portfolio instead of collecting disconnected tools. | Build The AI Portfolio
The American Hospital Association reported in 2024 that 46% of hospitals and health systems used AI in RCM and 74% used some form of revenue cycle automation. The harder question is: which investments can scale into governed execution? Connect claims editing and clean-claim validation, accounts receivable follow-up and payment posting and reconciliation through shared data, priorities and outcome measures. Revenue cycle platforms should be judged by whether intelligence becomes action, experts receive the right exceptions and leaders can see what changed.
Use this executive dashboard to decide what scales next. | Use The Decision Dashboard
The following framework converts adoption and ROI into four decisions.
Open accountability turns AI activity into durable performance.
Before scaling, ask five questions: What measurable problem is being solved? What baseline defines realized improvement? What can AI execute without intervention? Which exceptions require expert judgment? Can every action, error and outcome be traced? Those questions align AI investment with First-Pass Performance and Open Accountability. They also prevent technology from hiding fragmented ownership. The strongest portfolio does more than recover revenue faster. It learns from downstream failures, corrects upstream causes and gives the provider visibility and control.
The next revenue cycle AI advantage will come from selective scale.
Every revenue cycle AI use case does not scale equally. The framework helps leaders distinguish proven workflows, under-adopted opportunities and applications that need redesign. A practical next step is to assess each use case against financial value, rework reduction, execution readiness, autonomy potential and governability. That is how health systems move from isolated pilots to scaling with technology, reducing cost to collect and accelerating cash. This physician enterprise case study illustrates the value of treating revenue cycle as a learning system rather than a sequence of disconnected queues.

How healthcare providers can prove 3x ROI from AI in revenue cycle
AI now has to earn its place in the revenue cycle. | The 3x Test
Healthcare AI has moved from experimentation to financial scrutiny. A 2026 Bain and KLAS healthcare IT study of 303 U.S. healthcare executives found that about 95% of providers and payers place software and digital technology among their top five priorities. Yet leaders increasingly want a specific use case, measurable returns, and short time to value. Among organizations with formal thresholds, the most common hurdle is a 3.0x to 3.9x return.
That changes the question for a healthcare leader. The decision is no longer whether AI sounds promising. It is whether an AI-enabled workflow can improve cash, cost, capacity, or risk enough to justify its full economic footprint, while strengthening the patient and workforce experience.
The 3x test begins with a financial baseline, not a demo.
A credible business case starts with the current cost of the problem. Measure denial write-offs, avoidable touches, manual minutes, outsourced expense, delayed billing, underpayments, and the opportunity cost of staff trapped in queues. Then establish the baseline across front-office workflows, mid-office workflows, and back-office operations before the AI intervention.
Use a simple formula: annual value equals incremental revenue protected or recovered, plus operating cost removed, plus the financial value of capacity created, minus technology, integration, implementation, governance, and change costs. A 3x case exists when annualized measurable value is at least three times the fully loaded investment, using conservative assumptions and an agreed measurement window.
Four value pools reveal whether AI is creating enterprise value. | Value Pools
First, quantify revenue outcomes. AI may support faster cash conversion, identify revenue leakage, or improve claim quality. Second, measure labor economics through lower cost to collect, fewer repeat touches, and better exception routing. Third, value capacity created: staff time redirected from repetitive work to complex accounts, payer escalation, or patient support. Fourth, measure speed: shorter authorization, coding, billing, denial, and A/R cycle times.
The American Hospital Association reported that hospital use of predictive AI integrated with EHRs rose from 66% in 2023 to 71% in 2024, with administrative-efficiency use cases growing fastest. AHIMA likewise describes AI and machine learning as tools that can modernize billing and coding. Adoption, however, is not ROI. Financial value appears only when insight changes the work and the outcome.
Detection creates potential, but execution converts it into return. | Execution Over Detection
An algorithm can flag a denial risk, missing documentation, coding variance, or authorization gap. If the alert enters another queue, arrives after the claim is built, or lacks an accountable owner, the organization has purchased detection without resolution. Rework remains, and the apparent productivity gain may simply move labor downstream.
The stronger design connects intelligence to action. In medical coding, that means pairing automation with certified judgment and quality controls. In scheduling and registration, it means correcting defects before they contaminate eligibility, authorization, claims, and collections. Across revenue cycle technology, it means integrating AI with workflows, escalation rules, audit trails, and human exception management.
This is why first-pass performance is a better north star than automation volume. Measure the percentage of work completed accurately the first time, then trace repeat defects to their source. A stronger first pass reduces corrections, handoffs, delays, and rescues while improving the reliability of financial results.
An executive dashboard keeps the 3x claim honest. | The Executive Dashboard
The dashboard should show baseline, target, actual result, variance, financial value, owner, and next corrective action. It should distinguish gross benefits from validated savings, isolate one-time implementation costs, and prevent double counting across revenue, productivity, and capacity. A co-managed operating model can add capacity, but the provider should retain visibility into assumptions, work queues, quality, and realized outcomes.
Open accountability turns ROI from a forecast into a discipline. | Scaling With Accountability
AI ROI compounds when leaders can see what changed, why it changed, who owns the result, and what will happen next. Open Accountability creates that operating discipline without asking the healthcare provider to surrender control. Shared measures and transparent escalation expose weak signals early, while root-cause learning prevents the same breakdown from recurring.
Before scaling, require evidence at the workflow level: sustained first-pass improvement, lower rework, validated financial impact, stable quality, and acceptable compliance and patient risk. Then scale with technology across comparable workflows, rather than applying one enterprise-wide assumption to every function. The goal is not more AI. It is a transformed revenue cycle in which AI, automation, and practitioners consistently convert earned revenue into predictable performance. This Vee Healthtek case study on reducing A/R illustrates the value of combining operational learning with measurable financial improvement.

Evaluate revenue cycle management software before investing
Revenue cycle software should remove work, not move it.
Healthcare revenue cycle management spans registration, benefits verification, care delivery, claims and reimbursement. Evaluating revenue cycle management software therefore requires more than comparing features. Buyers must determine whether a platform prevents defects, reduces manual touches and converts signals into action across the patient-to-payment journey.
McKinsey’s 2024 health-system survey found that 75% of respondents gave digital and analytics transformation high priority but said their organizations lacked sufficient resources or planning. That makes disciplined evaluation essential: technology can accelerate a sound workflow, but it can also magnify fragmented processes, duplicate queues and unclear ownership.
The evaluation should begin with a defined operating problem. | Start With The Problem
State the constraint in operational terms: avoidable denials, authorization delays, coding backlogs, underpayments, high cost to collect or low productivity. Map where defects enter, where they surface and who resolves them. Then connect the use case to outcomes such as accelerating cash, reducing revenue leakage or scaling with technology.
A feature matters only when it changes work. For example, automated eligibility and benefits verification should prevent coverage defects before service; prior authorization should surface missing requirements before care; and clean-claim validation should stop avoidable errors before submission.
Six dimensions reveal whether RCM software fits the work. | Evaluate Six Dimensions
Evaluate coverage, prevention, integration, actionability, accountability and impact. Coverage asks which workflows are supported. Prevention asks what the product stops before failure. Integration examines EHR, payer, clearinghouse and workqueue connections. Actionability tests whether insight leads to the next best action. Accountability traces the owner and outcome. Impact measures financial and operational change.
The American Hospital Association reported in 2024 that 74% of hospitals had implemented some form of revenue cycle automation, while 46% used AI in RCM. Yet AI use remained concentrated in specific functions. Buyers should therefore assess production-ready use cases and governance rather than broad claims of end-to-end intelligence.
This RCM software evaluation scorecard turns software claims into buyer evidence.
Real workflow testing exposes hidden rework. | Expose Hidden Rework
Ask vendors to demonstrate representative accounts, including incomplete data and complex exceptions. Track false positives, manual interventions, handoffs and reconciliation outside the platform. A solution that identifies more issues but leaves people to resolve them across disconnected tools may increase work rather than improve first-pass performance.
Test front-, mid- and back-office dependencies. Registration accuracy affects claims; documentation affects medical coding; coding affects payment; and payer feedback should strengthen denials management and appeals. AHIMA’s revenue cycle resources emphasize the continued need for human skills as automation evolves.
Baselines make software value measurable. | Baseline Meaningful Metrics
Before implementation, establish clean-claim rate, initial denial rate, days in A/R, aged A/R, cost to collect, productivity, exception volume, manual touches and rework rate. Define formulas, data sources, owners and review frequency. Open Accountability should make each variance traceable from signal to owner, action and outcome.
Measure by payer, site, service line and workflow. Averages can hide adoption gaps or new bottlenecks. Include configuration, integration, training, maintenance and exception labor in ROI. This Vee Healthtek case study shows how governed execution inside an existing EHR sustained zero backlog and 95-98% QA across coding and revenue cycle teams.
A controlled pilot should precede wider deployment. | Test Through A Pilot
Select a representative workflow, clean baseline data and agree on success measures. Include operational users, finance, IT, compliance and health information leaders. Run enough real work to observe routine cases, exceptions and failure modes. Compare outcomes with the current process and document every dependency required to sustain results.
Scale only when the pilot demonstrates lower rework, stronger quality and measurable value. If performance depends on constant manual rescue, revise the workflow, configuration or operating model first. The objective is not another dashboard. It is a connected execution system that gets work right earlier and makes responsibility visible.
Implementation readiness should influence the buying decision.
A strong product can still underperform when data, roles and workflows are not ready. Assess interface ownership, data quality, security review, user training, change management and post-launch support. Confirm how the platform will connect payment posting and reconciliation with revenue integrity and leakage prevention so financial signals do not remain isolated within one team.
Ask who will tune rules, monitor model drift, maintain payer logic and resolve failed automations after go-live. Establish escalation paths and service levels before contracting. The revenue cycle rework trap becomes harder to escape when ownership is split across software, internal teams and vendors. A readiness review makes those dependencies visible before they become expensive surprises.

Choose effectively between RCM software and services
RCM software and services solve different operating needs. | Models Differ By Ownership
Healthcare revenue cycle management (RCM) runs from the first patient encounter through final payment. The choice between revenue cycle management software and RCM services is therefore not simply a technology decision. It determines who configures workflows, resolves exceptions, supplies expertise and remains accountable when performance moves off plan.
McKinsey reported in 2024 that 75% of surveyed health-system executives gave digital and analytics transformation high priority but said their organizations lacked sufficient resources or planning. That gap explains why a product can be valuable without being sufficient: software creates capability, while an operating model converts capability into consistent results.
RCM software gives capable teams greater leverage. | Software Fits Mature Teams
Revenue cycle management software is designed to automate, coordinate or analyze work across scheduling, eligibility and benefits verification, prior authorization, coding, claims, payment posting, denials and A/R. It fits organizations with standardized workflows, adequate specialist capacity, strong change management and leaders who can own configuration, adoption and ongoing optimization.
Software is strongest when it prevents defects before they travel downstream. It can validate registration data, flag documentation gaps, apply claim edits and prioritize accounts. AHIMA identifies prior authorization, ambient documentation, autonomous coding, denial prevention, claim submission and denial management among leading AI use cases, while emphasizing the importance of health-information expertise in implementation.
The risk is tool-led rework. Poor integration can create duplicate queues, false positives and manual reconciliation. Buyers should test whether software improves first-pass performance by reducing avoidable touches, not merely by making defects more visible.
RCM services add execution and specialized expertise. | Services Add Execution Depth
RCM services combine people, process discipline and technology to perform defined revenue cycle work. They may support a focused function such as medical coding or denials management and appeals, or connect front-, mid- and back-office workflows. Services are more appropriate when staffing shortages, backlogs, payer complexity or inconsistent performance limit an internal team’s ability to act on available insights.
The service model should not substitute activity for outcomes. Scope, quality, turnaround time, root-cause feedback and financial measures should be visible through Open Accountability. Providers should retain policy and strategic control while the partner owns agreed results, discloses emerging risk and returns recurring defects to the workflow where they begin.
A hybrid RCM model can balance control and execution. | Hybrid Models Balance Both
A hybrid model keeps the provider’s EHR and core governance while adding specialized execution, workflow orchestration or capacity. It can start with one constraint, such as registration accuracy, coding quality assurance or accounts receivable follow-up, then expand only when evidence supports the change.
The American Hospital Association describes intelligent RCM as an alignment of technology, people and processes, with standardized workflows and engaged teams preceding scale. For many providers, that is the practical case for a hybrid model: retain control and institutional knowledge, while adding accountable execution where throughput, expertise or transformation capacity is constrained.
This framework clarifies the best-fit RCM model. | Choose Through Outcomes
The right choice starts with the operating constraint.
Ask these five questions:
- Is the primary constraint technology, capacity, expertise, process design or accountability?
- Can internal teams act on every exception the software creates?
- Who owns integration and optimization after launch?
- Which measures will prove improvement?
- What happens if performance misses plan?
Baseline clean-claim rate, initial denials, days in A/R, cost to collect, productivity, manual touches and rework. Then compare total operating cost, not license price or hourly rate alone.
Proof should come from comparable environments. This Vee Healthtek case study describes a multi-hospital system that sustained zero backlog and 95-98% QA through governed execution inside its existing EHR. Another physician-enterprise case study reports A/R falling from $76 million to $46 million while recurring issues were moved into EHR logic, edits and education.
Your operating model should improve the whole cycle.
Choose software when the organization can supply the people and governance required to realize its value. Choose services when execution depth, specialist expertise or accountable capacity is the central need. Choose hybrid when capabilities vary by function and the provider wants to retain control while strengthening delivery.
Whichever model you choose, connect the decision to outcomes such as accelerating cash, reducing revenue leakage, improving revenue integrity and reducing cost to collect. The right model reduces rescue work, strengthens first-pass performance and makes ownership visible from access to A/R.
Have a Question for Vee Healthtek?
Vee Healthtek is a practitioner-led, technology-powered revenue cycle partner focused on building resilience through first-pass performance and open accountability. For service inquiries, company information, or questions about our latest announcements, complete the form below. We’ll direct your interest to the right team.
Continue exploring expert perspectives, industry trends, and practical strategies for improving revenue cycle performance.
Explore Points Of View